TrajAnalytics: A Free Software for Visually Exploring Urban Trajectories

Thanks to advanced technologies in sensing and computing, the mobility patterns and dynamics of urban cities and their citizen are recorded and manifested in a variety of urban trajectory datasets, which include the moving paths of human, taxi, bus, fleets, cars, and so on. Understanding and analyzing such large-scale, complex data is of great importance to enhance both human lives and urban environments. Supported by National Science Foundation, TrajAnalytics aims to provide exploratory data visualization tools for researchers, administrations, practitioners and general public to understand the data and to reveal knowledge intuitively.

  • User Guide: Click HERE for the online guidance of how to use TrajAnlaytics software. A PDF version can be found HERE.
  • Tutorial Video: Click HERE or check our Youtube channel to see our tutorial videos about TrajAnalytics and example use cases.
  • Feedback: Click HERE to send you feedback and comments to us.
  • Discussion Board: Click HERE to our discussion board for questions and comments.
  • Software License: TrajAnalytics is developed under BSD license. Click HERE for details.
  • Team: Click HERE to know our team and give your feedback.
  • Cite Us: Please cite us as:

    An Open Source TrajAnalytics Software for Modeling, Transformation and Visualization of Urban Trajectory Data, Shamal AL-Dohuki, Farah Kamw, Ye Zhao, Xinyue Ye, Jing Yang, The 22nd IEEE Intelligent Transportation Systems Conference, To appear, Auckland, New Zealand Oct., 2019. preprint

Cloud Version:

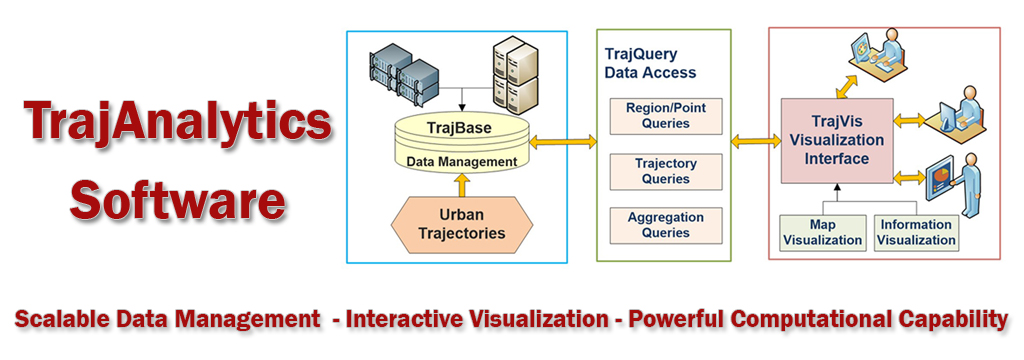
TrajAnalytics is developed as a cloud-based software which can be accessed through Web browsers. It supports users to load raw trajectory data, and perform road based map matching and aggregation, as well as perform region based map matching and aggregation. The generated data tables, including Trajectory Data (TD Table), Trajectory Data on Streets (TDS Table), or Trajectory Data on Regions (TDR Table), are stored in TrajBase database on our cloud. A TrajVis visualization interface allows users to conduct extensive visual analysis at any time. Please read the TrajAnalytics guideline for details. You can start to use TrajAnalytics below. For accounts and other help, please contact us at trajanalytics@gmail.com.


Data Loading


TrajAnalytics provides users with an independent data preprocessing software for users to load their own data to TrajAnalytics.


Road Map Matching


TrajAnalytics automatically fetch corresponding road segments data from OpenStreetMap and match the raw GPS data with road segments.


Region Map Matching


TrajAnalytics automatically match the raw GPS data with Zip code regions (USA Only) or Grid Regions.


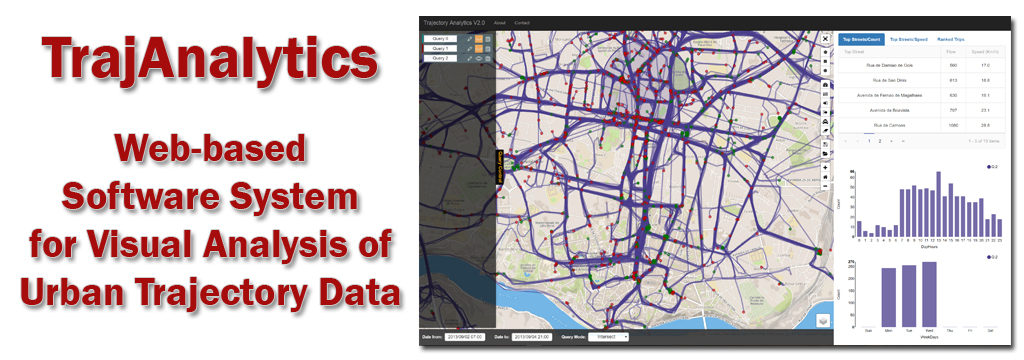
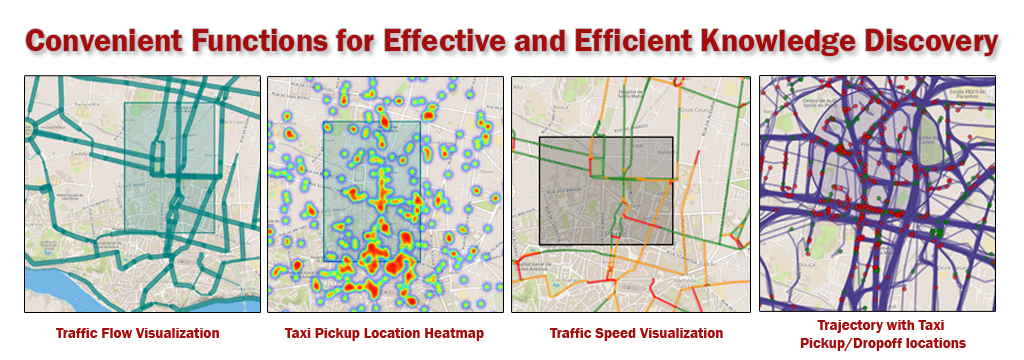
Visualization System


TrajAnalytics provides easy to user Web interface for visually analyzing urban trajectory datasets. It allows users to interactively visualize and analyze trajectories over urban spaces.

Local Version:

TrajAnalytics is also provided as local version for users to work with the software on their own machines. Please download below and read the included guidance carefully.

  • Data Conversion Module: Please click HERE to download. Users can upload the raw trajectory data by the Data Conversion Module. It will then be converted to the TrajAnalytics data tables (Please read the TrajAnalytics guideline for more details), which can be used in the local TrajAnalytics below.
  • TrajAnalytics Package: Please click HERE to download the first version (V1). A complete guidance of installation is included in the package.
  • TrajAnalytics Package: Please click HERE to download the second version (V2).


Responsive image

This work is partially supported by National Science Foundation ACI-1535031,1535081