Introduction:
TrajAnalytics is a publicly available software for visual analysis of urban trajectory data. Its major goal is to support researchers and analysts in transportation studies to conduct data driven analysis utilizing real-world trajectory data. The visual analytics software, TrajAnalytics, helps users extract deep insights with:
- Iterative, evolving information foraging and sense making
- Interactive process using domain knowledge
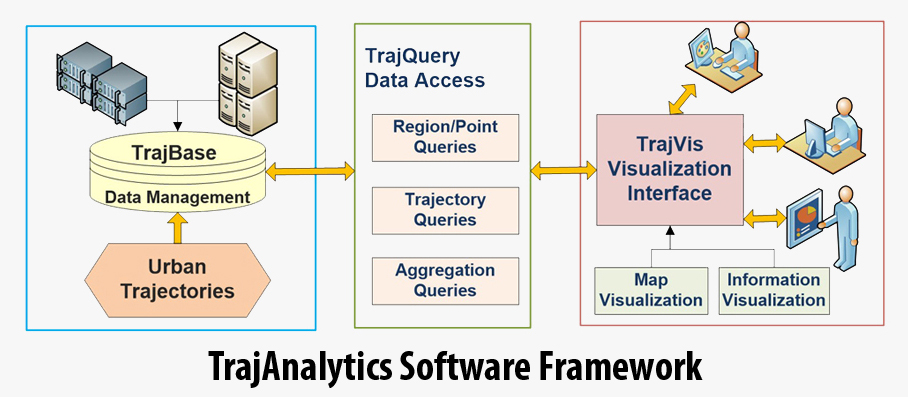
It Integrates scalable data management and interactive visualization with powerful computational capability with:
- Powerful computing platform
- Easy access web-based gateway
- Scalable data storage and management
- Exploratory visualization
Documents:
- See more details about TrajAnalytics software in an introductory slides and a poster.
- Moreover, a workshop paper introduces our software:
TrajAnalytics: A Web-Based Visual Analytics Software of Urban Trajectory Data, Ye Zhao, Shamal Al-Dohuki, Thomas Eynon, Farah Kamw, David Sheets, Chao Ma, Yueqi Hu, Xinyue Ye, Jing Yang, IEEE Workshop on Visualization in Practice : Open Source Visualization and Visual Analytics Software, IEEE Visualization Conference 2016, Baltimore, Oct, 2016. - For more background and state of the art of visual analytics in transportation, check the following survey paper recently published in IEEE Transactions on Intelligent Transportation Systems:
Visual Analytics for Transportation: State of the Art and Further Research Directions, Gennady Andrienko, Natalia Andrienko, Wei Chen, Ross Maciejewski, Ye Zhao, IEEE Transactions on Intelligent Transportation Systems, Volume: 18, Issue: 8, Aug. 2017, 2017 (Lnk).
Taxi Trajectory Datasets:
Our software currently is developed and tested on taxi trajectory data which are the most widely used and available trajectory datasets. In general, taxi trajectory data can be classified into two types, OD data, and trajectory data. OD data reporting about where the taxi trip starts (pickup) and where it ends (dropoff). Each record denoted as (Xs, Ys, Ts, Xe, Ye, Te) where Xs, Ys, Xe, Ye represent geographic coordinates of a taxi trip start (pickup) and end (dropoff) at time Ts and Te. While trajectory data consists of the path that a taxi follows through space as a function of time. Thus, it can be captured as a time-stamped series of location points, denoted as (X1, Y1, T1, X2, Y2, T2, ..., Xn, Yn, Tn) where Xi, Yi represent geographic coordinates of a taxi at time Ti and n is the total number of elements in the series. We will test and publish the specific TrajAnalytics versions for other types of trajectories such as mobile device trajectories, social media user trajectories, public transit, and more.
TrajAnalytics Test Demo:
Two online prototypes for TrajAnalytics software test and evaluation. The first one uses the (OD) data of many taxi trips collected in New York City in 2013. The second one uses the trajectory data of many taxi trips collected by taxi cabs in Porto City in Portugal between (07,2013) to (06,2014). Please, follow the links below to check our systems: