NeighborVis Features:
NeighborVis is developed as a Web-based system so that users can use it through web access to remote server platforms. It can also be used solely as a localized version on desktops and laptops. As illustrated by figure 1, it supports a full data processing pipeline with the functions of:
- Data Loading and Processing: allow users to upload raw data including GSE data and geographical shape files. The loaded data NeighborVis supports users to upload multiple datasets.
- Database Storage: The loaded GSE datasets are transformed and stored into the NeighborVis database. The corresponding map with geocontext is also loaded. The database we currently used is designed based on MongoDB and it supports both local and server based operations.
- Data Management: allow users to interactively define active GSE data resources for visual analysis. Users can select more than one datasets at the same time which is important for comparable and integrative study of multiple data sources.
- Visual analysis: allow users to conduct interactive data visualization and analysis with a set of charts, filters, maps, and other visual functions through human-machine interactions
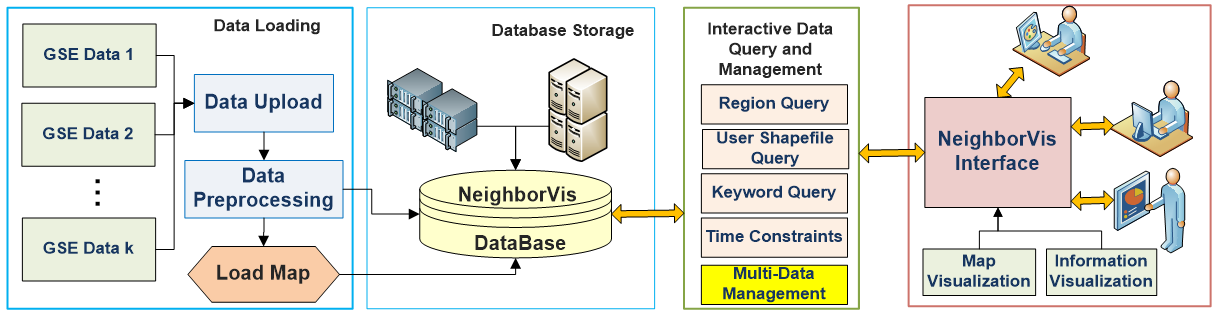
Figure 1: NeighborVis System
GSE Datasets :
GSE data consist of a set of geospatial semantic events. Each event at least contains three important attributes, location, time, and semantic description, while many of them have a categorical attribute (about classes, types, or kinds) as well. Then the data may have more fields related to specific fields but cannot be predefined in NeighborVis. In data loading function, we check and validate that each raw dataset has the following attributes:
- Event ID, a unique identification number for a GSE record.
- Date/Time, which indicates when this event happened. This attribute should have the format as YYYY-MM-DD HH:MM:SS.
- Geolocation of longitude and latitude, which indicates where an event happened.
- Text, which is the semantic description of this event.
- Category (optional), which is the category this event belongs to.
NeighborVis Overview:
Figure 2 shows the data and operation flow of NeighborVis system. The use of NeighborVis consists of three stages:
- GSE Data Preparation
- GSE Data Queries
- GSE Data Analysis
Raw data is first loaded into NeighborVis database. Then users can select a set of working datasets for their current task. Once the data preparation is done, the working datasets can be interactively checked to make as active datasets. Users can view events of active datasets on the map globally as heatmap or markers.
A query is the fundamental operating units of NeighborVis analysis. One query refers to a set of events (may coming from multiple active datasets) inside a geospatial region and a given time period. Users can define a query by drawing regions on the map by mouse, or loading predefined regions from GIS shapefiles.
Once a group of queries are defined, users can manage them to visualize one or more queries on the map. Meanwhile, details of queries are shown to study their contents. A set of visual representations and tools are implemented to support interactive analysis of queries.
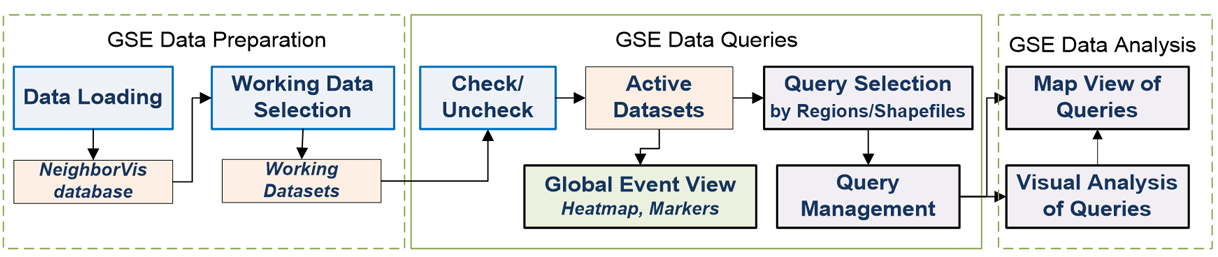
Figure 2: NeighborVis Data and Operation Flow