Sample ongoing collaborative projects in multiple locations:
NeighborVis software and social media data are being combined with these projects to gain a wider perspective and further context for community study. Sensitive information is hidden in the figures.
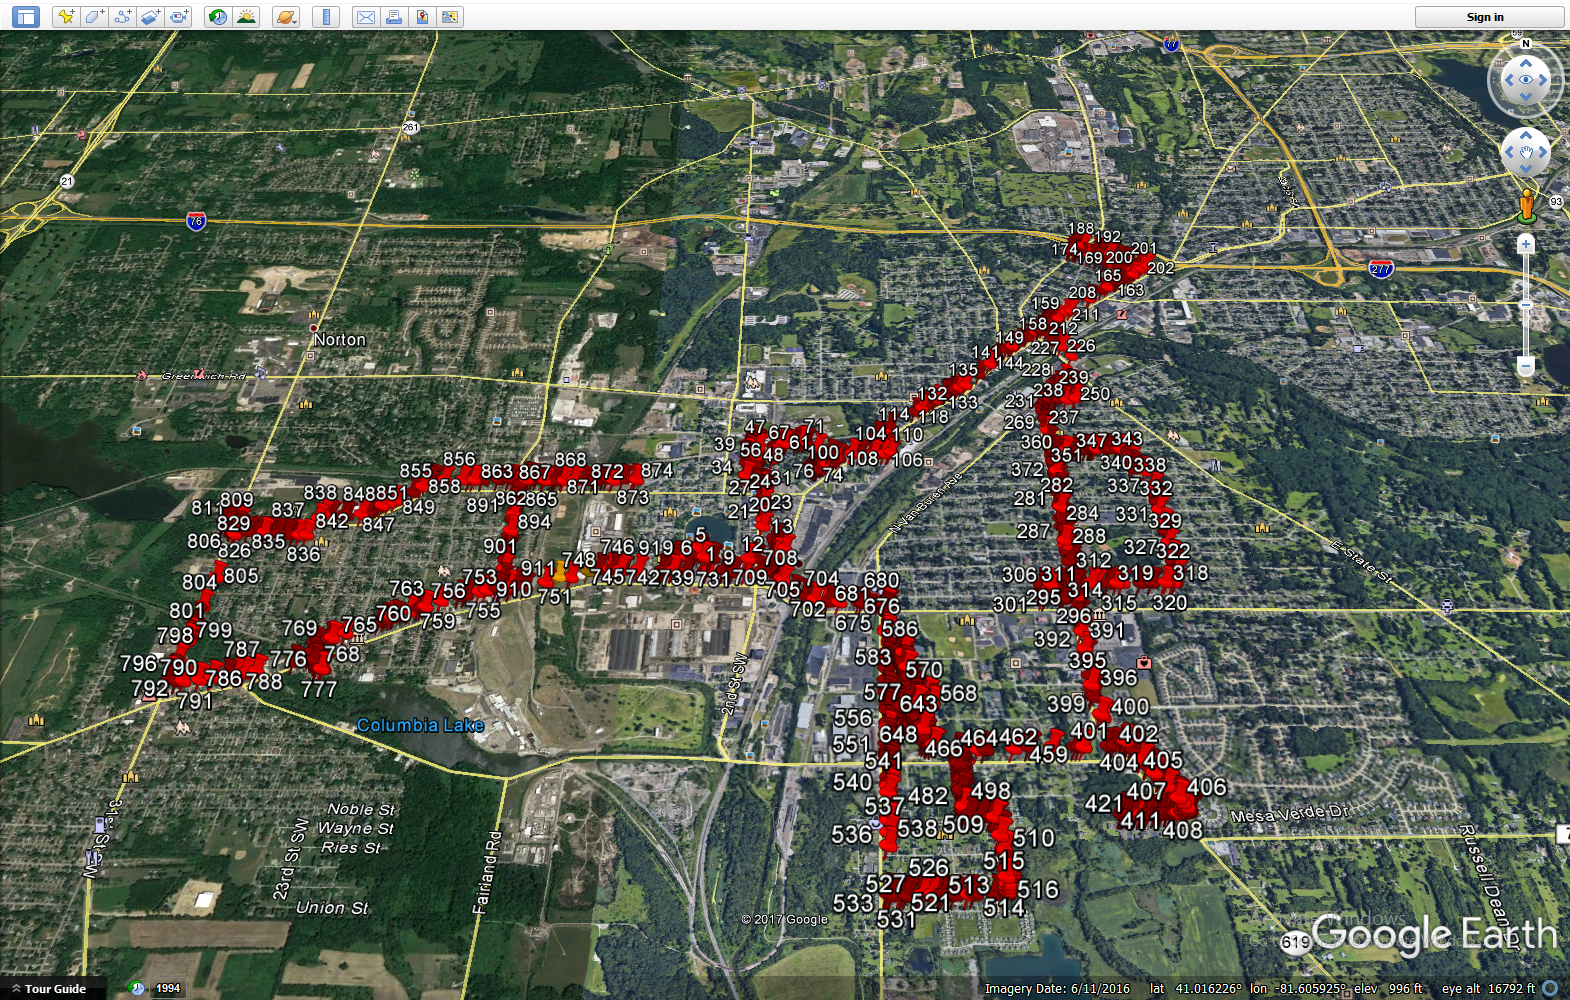
Barberton, Ohio
This map shows the collected geonarrative in Barberton, Ohio in Google Earth. The subject described various aspects of recent opioid overdoses.
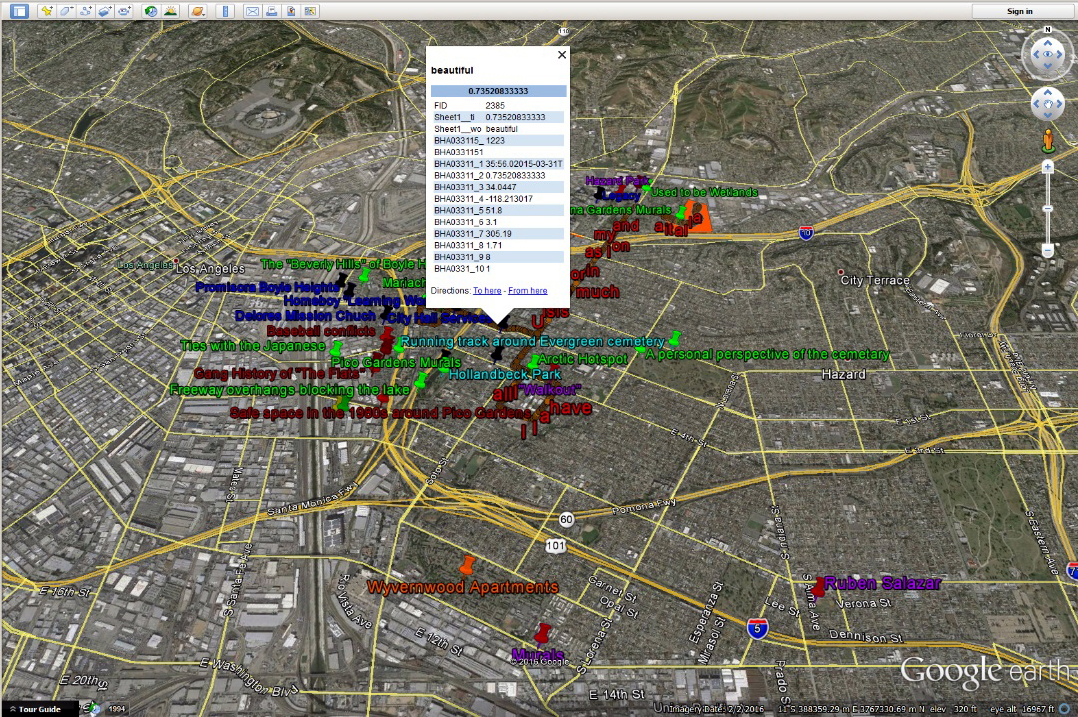
Cleveland, Ohio
This map displays a similar approach. The collected spatial data is from the expert who is a community non-profit worker describing various aspects of the community. The purpose here is to guide development/enhancement strategies.
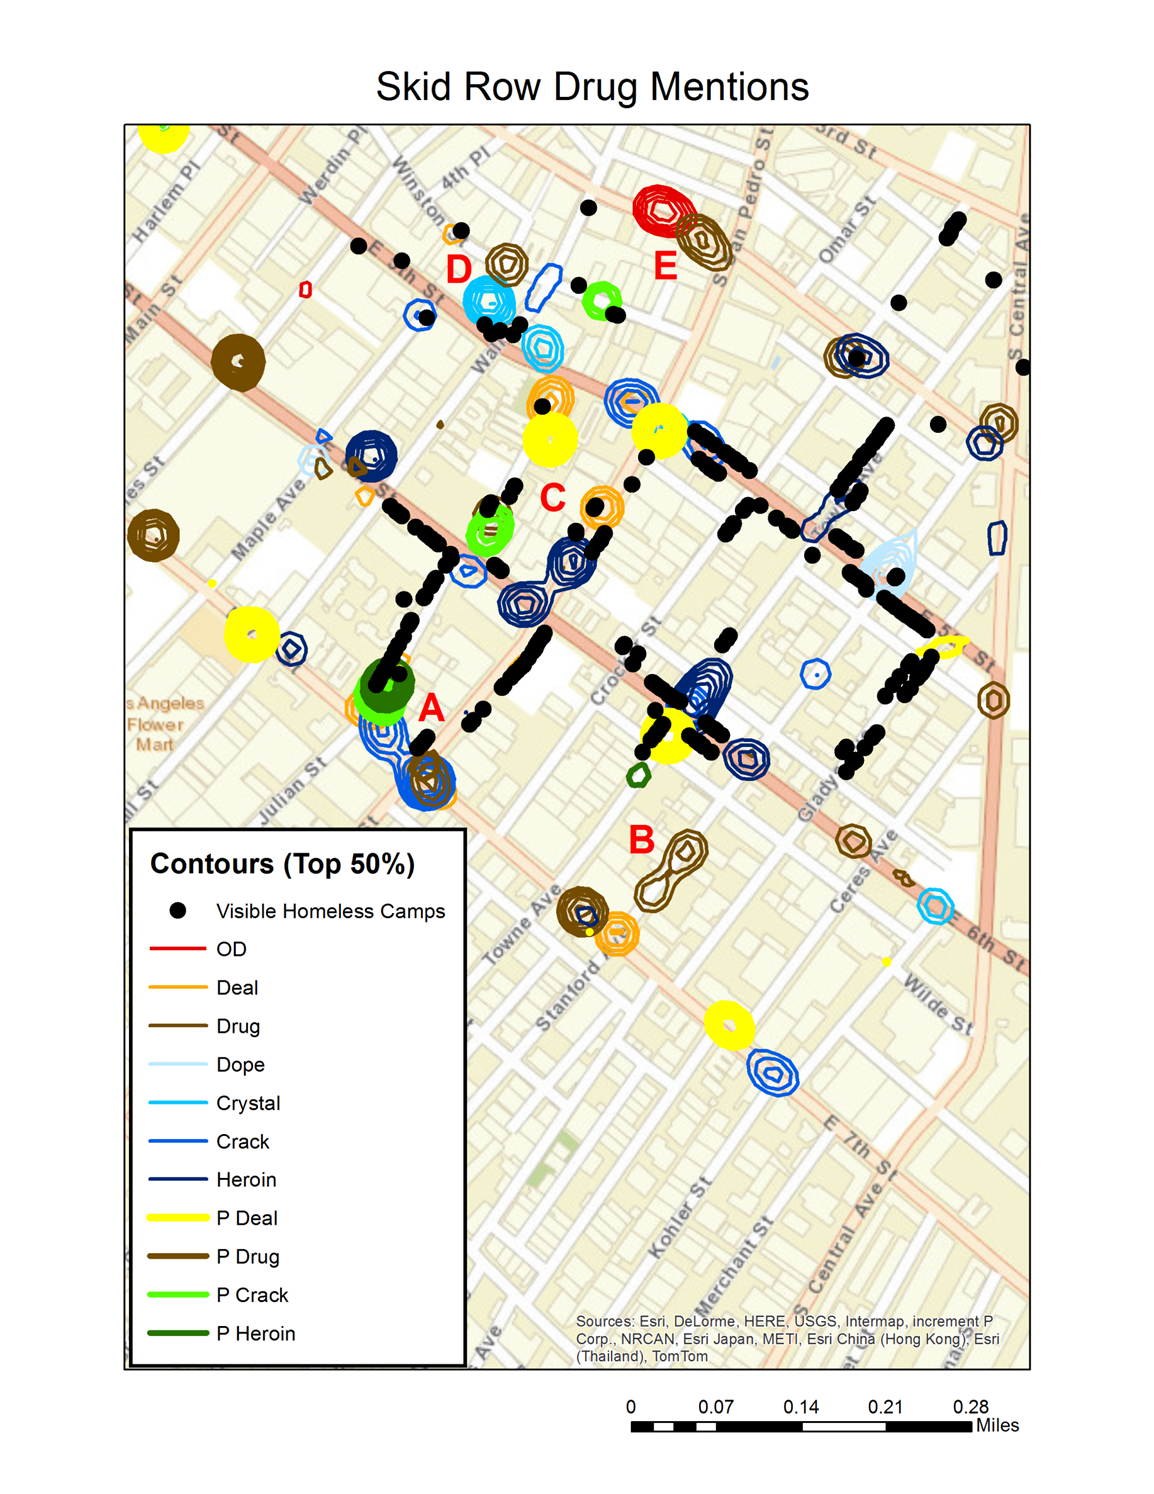
Los Angeles Skid Row
This map displays data attained through multiple interviews, mapped in a similar way to the other two maps, but then combined in a GIS to identify drug hotspots.